Viewing terminal status
The POS Health Dashboard displays the status of terminals from specific sites in the organization. To view the status of terminals in an enterprise, select Terminal Status from the side menu of the dashboard. The application displays the Terminal Status screen.
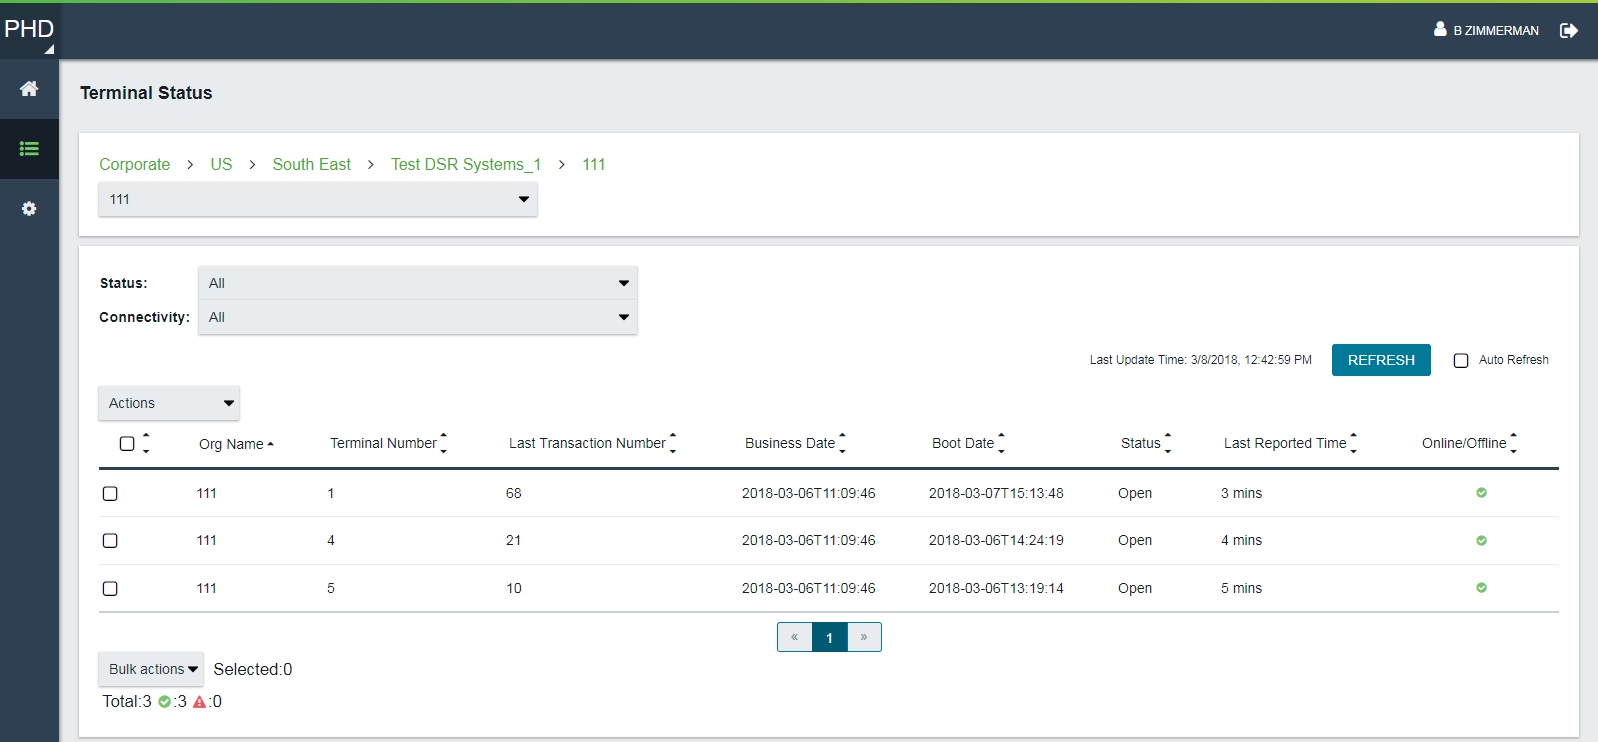
The following table describes the information displayed on the screen.
| Field | Description |
|---|---|
| Select All checkbox | Selects all the terminals displayed on the page. |
| Org Name | Displays the store numbers included in the selected site. |
| Terminal Number | Displays the terminal numbers included in each store. |
| Last Transaction Number | Displays the transaction number of the last transaction completed in each terminal. |
| Business Date | Displays the business date of the store. |
| Boot Date | Displays the last reboot date of a terminal. |
| Status | Displays the status of the terminals. |
| Last Reported Time | Displays how long since a terminal last reported its connectivity status. |
| Online/Offline | Displays the connectivity status of a terminal.
|
| Total | Displays the total number of terminals in the selected site, total online terminals, and total offline terminals. |
| Pagination controls | Displays the pagination arrows. If the number of terminals is more than the configured rows per page, select the arrows to view a specific page. |
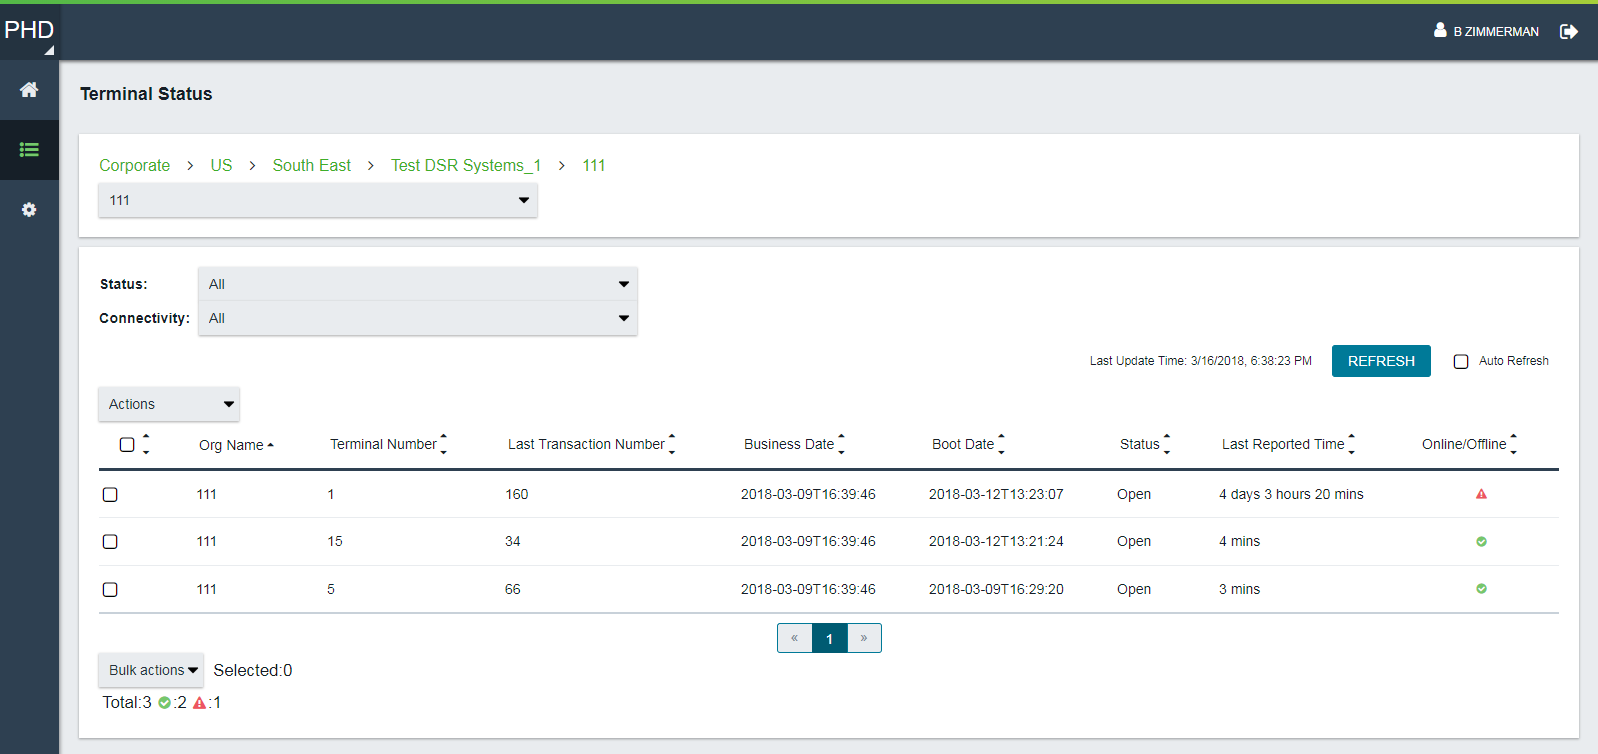
 —the terminal is online.
 —the terminal is offline.
Managing the Terminal Status page content
The Terminal Status page can be filtered depending on the user’s preference. To manage the Terminal Status page, follow these steps:
- From the drop-down list on the Terminal Status page, select a site in the organization. The site can be the whole enterprise, an entire region, a specific zone, or a specific store.
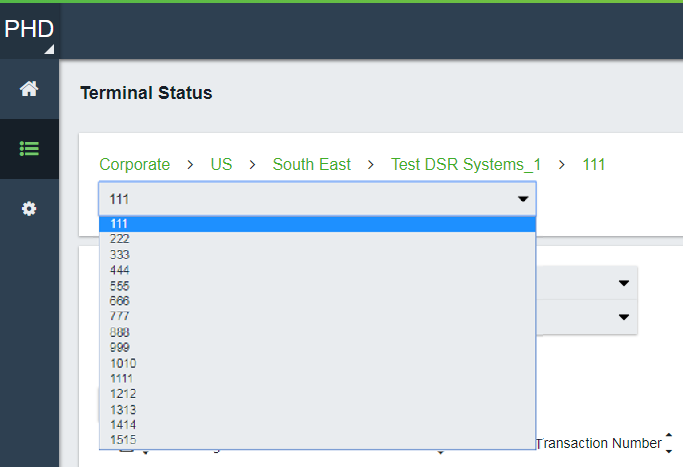
The page displays the terminals in the selected site.
- Select the up or down arrows beside the column name. The data in the column is sorted in ascending or descending order.
- To filter the status displayed on the screen, select one of the following from the Status drop-down list:
- All—displays all the terminals included in the site selected.
- Open—displays only the open terminals.
- Closed—displays only the closed terminals.
- To filter the connectivity status displayed on the screen, select one of the following from the Connectivity drop-down list:
- All—displays all the terminals included in the site selected.
- Online—displays only the online terminals.
- Offline—displays only the offline terminals.
- To update the data displayed, do one of the following:
- Select Refresh. The page displays the updated data.
- Select the Auto Refresh checkbox. The page refreshes with updated data at a specific interval.
- To hide inactive terminals, follow these steps:
- Do one of the following:
- Select the checkbox for one or more terminals.
- Select the Select All checkbox on the column headers or select Bulk actions > Select all.Note
The Auto Refresh button is disabled when any row is selected.
- Select the Actions drop-down list, then select Remove selected. The dashboard displays a confirmation message.
- Select Confirm. The dashboard hides the selected terminal from the screen.
When the hidden terminal becomes active and completes a transaction, the terminal is redisplayed on the dashboard.
- Do one of the following: